E-ISSN:2583-0074

Research Article

Product Development

Social Science Journal for Advanced Research

2025 Volume 5 Number 1 January
Publisherwww.singhpublication.com

Evaluating the Effectiveness of Product Development Strategy on First National Bank Financial Performance

Kumwenda E1*, Mulenga A2
DOI:10.5281/zenodo.14792728

1* Esnart Kumwenda, Graduate School of Business, University of Zambia, Lusaka, Zambia.

2 A Mulenga, Graduate School of Business, University of Zambia, Lusaka, Zambia.

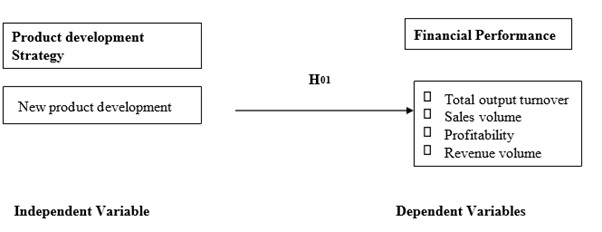
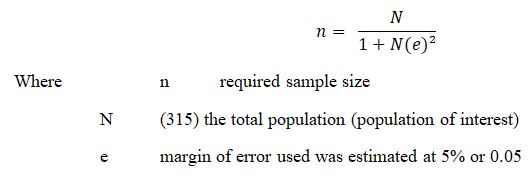
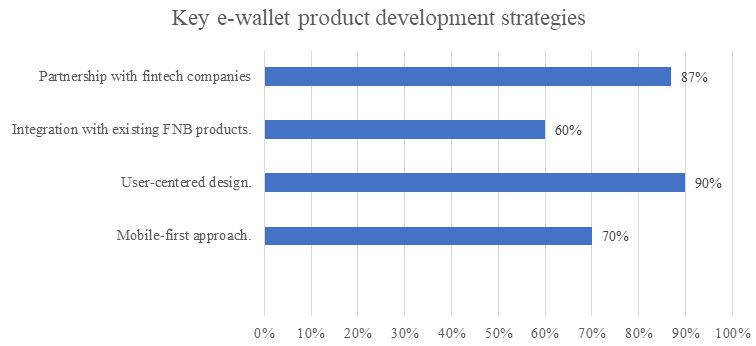
Product development strategy is crucial for banks to remain competitive and achieve financial success. This study was aimed at evaluating the effectiveness of product development strategy on the financial performance of FNB in Lusaka. The study adopted a quantitative approach using survey questionnaires and panel analysis of financial data from 09 FNB branches in Lusaka. The results of the study revealed that the majority of respondents were middle-aged males with some experience and a first-degree education. Over 60% were aware of product development strategies, with short- and long-term financing options being key strategies. The study revealed a weak positive relationship between product development strategy and financial performance. The correlation between ROA and the predictor variables (R=0.545 was greater than 0.5) meaning there was a strong positive correlation between ROA and the predictor variables. The coefficient of the regression analysis denotes the amount of deviation in the predicted variable that is to say ROA that is explained by the predictor variables. The square of R=0.297 reveals that 29.7% of the changes in ROA was attributed to predictor variables. The Durbin-Watson test statistic was 1.158 which indicated that no correlation existed among the residuals in the model. Effective product development strategies, such as innovation and customer-centric approach, contributed to improved financial performance. The implication of this study is that, the study's findings will provide insights into the effectiveness of the e-wallet product development strategy in improving financial performance at First National Bank, inform the development of effective e-wallet product development strategies, and contribute to the existing literature on product development strategy and its effectiveness on financial performance.
Based on the obtained results, The study recommends that FNB consider diversifying its product offerings to appeal to a broader demographic range and adopt effective product development strategies, such as innovation and customer-centric approach, to improve financial performance.

Keywords: product development, financial performance, strategy, digital banking, e-wallet first national bank

Corresponding Author How to Cite this Article To Browse
Esnart Kumwenda, , Graduate School of Business, University of Zambia, Lusaka, , Zambia.
Email:
Kumwenda E, Mulenga A, Evaluating the Effectiveness of Product Development Strategy on First National Bank Financial Performance. soc. sci. j. adv. res.. 2025;5(1):21-36.
Available From
https://ssjar.singhpublication.com/index.php/ojs/article/view/216

Manuscript Received Review Round 1 Review Round 2 Review Round 3 Accepted
2024-12-29 2025-01-14 2025-01-28
Conflict of Interest Funding Ethical Approval Plagiarism X-checker Note
None Nil Yes 3.65

© 2025by Kumwenda E, Mulenga Aand Published by Singh Publication. This is an Open Access article licensed under a Creative Commons Attribution 4.0 International License https://creativecommons.org/licenses/by/4.0/ unported [CC BY 4.0].

Download PDFBack To Article1. Introduction2. Literature Review3. Empirical Review4. Theoretical and
Conceptual Frameworks
of Product Development
Strategies
5. Conceptual Framework6. Methodology7. Results8. Discussions9. Conclusions and
Recommends
References

1. Introduction

Background of the Study

There is substantial anecdotal evidence indicating that product development strategies positively influence a company’s financial performance. However, studies show mixed results across various performance measures. Higher profits are often linked to firms' innovation capabilities (Schumpeter, 1934). The performance of development projects depends on a firm’s product strategy and process organization (Clark & Fujimoto, 1991). Financial losses from product failures can outweigh gains from successes (Sharma & Lacey, 2004). Effective product development relies on design creating positive experiences (Clark & Fujimoto, 1991), with combined product and process innovations driving firm growth (Goedhuys & Veugelers, 2008), leading to better sales growth and financing access. New product development is crucial for new firm performance despite its cost and uncertainty (Haeussler, Patzelt & Zahra, 2012). The risk of market failure remains high due to lack of sound scientific knowledge for product teams to develop high-quality product concepts (Wanjiru, Muathe, & Kinyua-Njuguna, 2019).

Despite widespread access to information, few companies seek research on product development methodologies. Research into firm performance must consider profit and growth, essential for business sustainability (Gultinan, 2017; OECD, 2020). Companies must implement robust competitive strategies to navigate uncertainty and dynamic business environments, enhancing operational efficiency and market share (Kehinde & Ikioda, 2019). Performance indicators are essential for monitoring success and improving processes (Franceschini et al., 2018). Adapting to market changes through successful new product development is critical for long-term success (Griffin, 2016). Sustainable competitive advantage is achieved through a unique market position relative to competitors (OECD, 2020).

The development of new products, while expensive and risky, is necessary for maintaining market position. It requires customer orientation, collaboration, and unique activities (Wanjiru et al., 2019). Systematic development methods and market research are key to success (OECD, 2020; Amar, 2016). Organizational knowledge is crucial for

achieving competitive advantage (Miles, 2027). Technological innovation and market competition necessitate continuous product development to maintain strong market positions (FNB, 2022). Forward-looking organizations recognize the importance of developing new and improved products to capture a large market share (Kotler & Keller, 2016). This study evaluated the effectiveness of product development strategies on FNB’s financial performance in Zambia.

Statement of the Problems

Despite the Increasing demand for digital financial services, First National Bank (FNB) Zambia's E-Wallet Product Has Not Achieved Its Full Potential, with only 12% of customers actively using the service (FNB Zambia, 2020). This slow adoption has resulted in a 15% decline in transactional revenue over two years (FNB Zambia, 2020). Despite the importance of effective product development strategies for digital financial services (Manyika et al., 2016), there is a lack of empirical evidence on the effectiveness of such strategies in the Zambian banking sector, particularly for E-Wallet products (Kapenzi, 2018). This study aims to address the research gaps by investigating FNB Zambia's product development strategies for its E-Wallet product, the effectiveness of these strategies on financial performance, and the challenges faced in implementing these strategies.

General Objectives

The general objective of this study is to evaluate the effectiveness of product development strategy' on FNB financial performance.

Specific Objectives

1. To examine product development strategies employed by FNB Zambia for its e-wallet product.
2. To Investigate the effect of these strategies on FNB Zambia's financial performance.
3. To identify challenges faced by FNB Zambia in implementing the product development strategy across their branches.

Research Questions

1. What product development strategy (s) have been employed by FNB Zambia for its e-wallet product?
2. How has been the effectiveness of these strategy (s) on FNB Zambia's financial performance?


3. What are the challenges faced by FNB Zambia in implementing the product development strategy across their branches?

Significance of the Study

This study explores the relationship between product strategy and customer satisfaction, providing valuable insights for businesses to improve their product offerings and enhance customer satisfaction (Saquib et al., 2013). The study highlights the importance of product quality, product mix strategies, and promotion strategies in achieving customer satisfaction. By examining the effects of these strategies, the study provides a comprehensive framework for businesses to develop effective product strategies that drive customer satisfaction and loyalty (Paley, 2016).

2. Literature Review

Concepts of Product Development

According to OECD, (2020) defined new product development as any product that consumption tract as an addition to the available choice. Product development strategy is a product-market growth strategy in which the existing market is served; however, a newer, significantly improved product is launched (Wanjiro et al., 2019). This involves next generation products. An example of such a strategy is that a product is improved for the same market to sell more. Regularly, the old product is not sold anymore, only the new and improved product is sold to the customers. However, it is possible that the old product is still sold next to the new and improved product. People who do not want to switch to the new product can still buy the older version. This strategy is used to keep customers satisfied and to stay ahead of the competition (Porter, 1990; Kotler and Keller, 2016; Grifin, 2016). In pursuing a strategy based on product development, management is attempting to sell a new product to existing customers. Efforts are focused on the development and innovation of new product offerings with which to replace existing ones. New products are then marketed to existing customers. This often occurs within the automobile market where existing models are updated or replaced and then marketed to existing customers (OECD, 2020).

Product of Product Development Strategy

Product development has been defined as the focus

on the needs of the current customers and the wider customer markets (Ansoff, 1987). Kotler (2000) says in product development a firm remains in its present markets but develops new products for these markets. The view that new products are helpful to the financial health of sponsoring firms is well argued by scholars. Schumpeter (1934), for instance, opined that innovative new product when first introduced face limited direct competition and, as a result, allow relatively high profits to sponsoring firms. Over time these high profits are likely to disappear because of imitation and competition, he argued, but firms that keep on introducing innovative new products may be able to have high profitability for a sustained period. Large and growing literature supports the positive correlation between innovation and firm profitability. In a study of 721 U.K. manufacturing firms during the period 1972–1983, for instance, Geroski et al., (1993) showed that the number of innovations produced by firms had a positive effect on their operating profit margin. According to Clark and Fujimoto (1991) performance in a development project is determined by a firm’s product strategy and by its capabilities in overall process and organization. They further claim that firm’s products help to shape the market environment; the nature of the market environment changes as consumers and competitors learn from new products and services. Goedhuys and Veugelers (2008) found that innovative performance is an important driver for firm growth in particular the combination of product and process innovations that significantly improves firm growth. Financial markets may be attuned sharply to product development outcomes in publicly traded firms (Anurag and Nelson, 2004).

The Concept of Product Life Cycle

This concept involves the end user at inception and throughout the life of the product or service is essential to ensuring that the organization is listening to the customer. For Strategic purposes when examining market competition, focus needs to be on quality as it has a way of guaranteeing customer loyalty. Quality can be viewed from many angles as it affects all aspects of an individual’s activity and includes work and life, and is said to be the compliance with a particular specification. For this purpose, it shall be defined as the quality of a product or service (Dudek-Burlikowska, 2011).

The key success factor of any marketing campaign


or activity is to attract new customers and increase their need and desire for a certain product or service (Ebitu, 2014). Therefore, it is very crucial for marketers to ascertain the consumer’s expectations of the product or service in order to satisfy them (Ebitu, 2014). Customer quality demands can be determined by the answers customers give to these five questions: What can I expect, when I buy this product or service? Is this what I expected? Does this product or service measure up to my expectations, all the time? How much do I pay for the product or service? When will I get this product or service? (Dudek-Burlikowska, 2011).

In order to formulate an appropriate marketing strategy, Hofer in 1975 argued that it is important to know the stage the product is within its life cycle (Horvat, 2013). Customers tend to equate product quality and safety by what is known of the particular brand and the overall look of the product (Mohan & Aagasthiya, 2015). One of the marketing strategies implements perceived concerns of clients, the company’s product branding improves. This strategy is employed so as develop a product or service that can satisfy the customers, ensuring steady and increased sales and profits to the organization (Ebitu, 2014).

The Zambian Banking Industry

The market is dominated by larger market players across key indicators such as Profit after tax, Return on equity, Total assets and Shareholder’s equity (BOZ, 2022; World Bank, 2020). While the overall structure of the market has not changed much, the disparity at the far ends of the spectrum is continuing to widen and the availability of capital remains a key differentiator. As banking continues to evolve and the need for investment in new products and delivery channels becomes ever more apparent, the smaller players are likely to be more affected. Whether this results in some level of market consolidation within the banking sector and/or with non banking financial institutions remains to be seen.

Profitability of Zambians banks has generally been buoyant, generated from earnings on loans, Treasury securities (BOZ, 2018). Realised gains on foreign exchange transactions and fee income have also contributed significantly to banks’ profits. Commercial banks in Zambia have continued to show resilience, largely credited to the strong capital position.

A majority of banks hold capital balances above the regulatory threshold, depicting the strength and stability of the Zambian banking sector. To boost the banks’ capital position and strengthen their resilience, the authorities raised regulatory capital further and introduced a tiered structure in April 2012 (GRZ, 2012). The minimum capital requirement for local banks was raised to K104 billion (US$20 million) while the requirement for foreign banks was pegged at K520 billion (US$100 million). Prior to this revision, the minimum regulatory capital was uniform across all banks at K12 billion (about US$2 million). The authorities argue that the new capital requirement is expected to boost banks’ lending to the private sector. The market has also recorded an increase in number of banks accompanied by growth in nominal assets, accounting for more than 90% of total financial industry assets, which is ten times higher than other market participants (Simpasa, 2013; Boz, 2018; Zambanker, 2018). Financial institutions are affected directly by changes in the macro-economic environment, arguably more than any other sector (BOZ, 2018) . It is therefore, cardinal that banks take in key interests in product development strategies. Since, products must be developed in line with specific needs of the customers and at a price they can afford for businesses to remain afloat.

FNB Zambia received its banking license in November 2008 and began operating in 2009 with an initial three branches across Lusaka and the Copperbel (FNB, 2023)t. The bank has since grown to include a national footprint and now it has its presence across all 10 provinces of Zambia through a network of ATMs, Branches, and CashPlus agency banking solutions.

First National Bank (FNB) has revolutionized the Zambian banking sector since its inception in 2009. It has introduced modern technologies like online banking and mobile apps, leading to increased convenience for customers (FNB, 2023). FNB's extensive branch network and agency banking solutions have promoted financial inclusion by reaching underserved areas. The bank's competitive products like loans and credit cards have encouraged other banks to improve their offerings. FNB's focus on customer service has raised the overall banking experience, while its corporate social responsibility initiatives have positively impacted local communities (Ibid).


Overall, FNB has brought healthy competition, innovation, and improved services.

3. Empirical Review

Recent studies have highlighted the importance of new product development strategies on firm performance (Benson et al., 2015). Research has also shown that a stronger connection between market-oriented and resource-based views improves strategy development and business performance (Acur, 2014). However, further research is needed to investigate the validity of these approaches in practice (Acur, 2013).

Benson et al, (2015) carried out research on effect of new product development strategy on performance in sugar industry in Kenya, the problem centered in this research focused on challenge of liberation, increase in competition among the firm in the industry, the research adopted survey research design method and a sample of fifty (50)respondents were selected, the aims and objective of the study is to investigate the relationship between new product development and performance of firms in sugar industry, the research used quantitative method in this study and has drawn from both primary and secondary source of data, questionnaire was used for the collection of data from the respondents, the research findings indicate that new product development strategy increase the performance of firms in sugar industry (Ibid).

While examining empirically the effects of new product development outcomes on overall firm performance, Anurag and Nelson (2004) chose the pharmaceutical industry as the empirical context. This was appropriate for the study’s analysis due to the gate-keeping role played by the Food and Drug Administration (FDA) provides a specific event date on which to focus the event study methodology. The study estimated market model parameters using a 300-day period. Daily return data were obtained on individual securities from DataStream International and abnormal return for firm. The expected returns were estimated using the market model where returns on security, the daily returns of each firm in days were regressed against the return on market portfolio during the corresponding time period to obtain estimates. This study’s results showed that market valuations are responsive strongly and cleanly to the success or failure of new product development efforts.

Further conclusions were that financial markets may be attuned sharply to product development outcomes in publicly traded firms (Anurag and Nelson, 2004). However, the study did not consider the intersection of marketing and finance literature.

Strategic Alliances and Product Development in High Technology New Firms, with the moderating effect of Technological Capabilities study was done by Haeussler (2008). Using a database of biotechnology firms the study sought to know how new firms maximize the benefits of these alliances while reducing their risks. Testing the study hypotheses required measuring the alliance portfolio, technological capabilities and product development by HTNFs. The study surveyed biotechnology firms in the UK and Germany, the largest and most developed biotech industries in Europe. Face to face Interviews were conducted with 118 British and 162 German firms which agreed to participate in the study. There was a response rate of 47 percent for Germany and 34 percent for the UK. In the study analysis the study used descriptive statistics to determine correlations among, the study’s variables. The study found that the specialization of new firms’ technological capabilities can help managers use alliances more productively when it comes to NPD. The results were stable over a variety of different model specifications and when accounted for the endogeneity of alliances (Haeussler, 2008). However, the results drew attention to the importance of the breadth versus depth of the degree of a firm’s technological specialization, an issue not explored in this study.

Cusumano and Nobeoka (1991) examined recent empirical research conducted or published on product development in the automobile industry. Their objective was to identify what has been learned, and what is yet to be learned about the effective management of this activity. The study focusesd 22 organizations from Japanese manufacturers in general, while the basic framework used to compare the studies examined variables related to product strategy, project structure or organization, and project as well as product performance. Evidence from the study indicated that Japanese automobile producers have demonstrated the highest levels of productivity in development as well as of overall sales growth, and have used particular structures and processes to achieve this (Cusumano and Nobeoka, 1991).


The evidence does not however clearly indicate what the precise relationships are between development productivity and quality or economic returns.

Other studies have emphasized the need for managers to understand their firm's core capabilities and direct resources to maintain and improve those capabilities (Wiley, 2015). Successful companies develop strategies that combine goods and services into a single product offer or "benefit package" (Lafarge, 2017). The factors that can enable or hinder the use of products strategy in production-level decision-making have been little studied Since the decision on manufacturing strategy is ultimately determined at the factory level, it has been suggested that more attention should be paid to organizational factors that can influence it, such as the organizational culture of the manufacturing company (Johnson , 2015). Organizational culture describes the complex knowledge structures that organizational members use to achieve and create social behavior and that are taught to new members as the right way to perceive, think, and feel about specific issues (Bates, 1995). Establishing a link between production strategy and organizational culture leads to a well-aligned and implemented production strategy that is associated with a clan-oriented organizational culture or is associated with a hierarchical organizational culture (Moran, 2008). Production strategy is essentially a top-down process where people in the factory respond to the production strategy and other formal control mechanisms (Bates, 1995). The analysis shows that next to the organizational culture of the clan appears a well-aligned and implemented production strategy, which includes a formal planning process, strategic communication, a contribution to a competitive position and a long-term orientation. This clan organizational culture is characterized using cliques and cliques, a low emphasis on hierarchy and high loyalty, and shares a plant-wide philosophy (Bates, 1995) adopted by Lafarge Zambia in the context of the RISE initiative (Lafarge, 2016 ).

Production strategy is a strategic asset that cannot be formed in a vacuum, but must be formed together with corporate strategy (OECD, 2020).

Culture plays a role in the manufacturing strategy and thus a systematic approach is preferred to enable the manufacturing strategy to succeed. Group-based interactive systems help develop a successful production strategy. Developing a great manufacturing strategy requires better intellectual capital. HR should look for smart people because they develop the production strategy. Some middle managers do not fully agree with the position of top managers because they lack clear strategic guidelines to base their operational decisions on (Kahinde and Ikiyoda, 2019). Other factors that directly or indirectly affect the strategic role of production are the attitude of top managers towards production and the lack of involvement of production managers in setting the strategic direction of the company (AL-Rasby, 2016). Example: Seeing manufacturing as unable to influence competitive success and encouraging manufacturing to blindly follow industrial labor, equipment procurement, and capacity building practices without understanding how manufacturing can provide a competitive advantage.

In Zamba Malamula, (2021), conducted study aimed at investigating how the Xapit mobile banking service has affected the bank‟s customer acquisition and retention in Zambia. The adopted quantitative research structure using primary and secondary data to accomplish the research objectives. The study found that that both the study variables (customer acquisition and Customer retention) had a negligibly positive relationship (r=0.033; P< 0.0226; r=0.006; P< 0.045) with Xapit product. It was thus established that, Xapit mobile banking service has positively affected the bank‟s customer acquisition and retention. This study further suggested that marketing team of the bank should do a wider and more detailed market research to determine what else needs to be done to improve Xapit banking services so that it gains more market share.

4. Theoretical and Conceptual Frameworks of Product Development Strategies

Various theoretical and conceptual frameworks have been developed around the concept of product development and have espoused measurement criteria;


drivers as well as variables that can be used to determine Customer Satisfaction (Al-Hersh, Abreu, & Saaty, 2014). For a business to be successful, whether it is dealing in a physical product or a service, it must satisfy their customers. This is mainly in two ways: retaining its current customers and increasing its customer’s base significantly. Both the current and prospective customers are the stakeholders and the determinants of the product or services success (Sabir, Irfan, Akhtar, Pervez, & Rehman, 2014). In 2001 Parker Mathews described two fundamental ways of interpreting satisfaction; as a process or as an outcome. As a process, satisfaction could be viewed as the emotional response of the customer to his evaluation of the difference or not of his prior experience with the product and or service and his current experience. If the perception is that the prior experience was more satisfying than the latter, then the end result is dissatisfaction; if, however the perception is vice versa then the end result is satisfaction (Al-Hersh, anurous, & Saaty, 2014). In this study two theories were considered, namely resource based and dynamic theory. This study is anchored resource-based view and dynamic capability theory.

Resource Based View:Resource based view theory has its origin from the work of Penrose (1959), though inadvertently the view was formerly presented by Wernerfelt (1984). A resource-based view (RBV) emphasizes the firm’s resources as the fundamental determinants of competitive advantage and performance. The model assumes first that firms within an industry (or within a strategic group) may be heterogeneous with respect to the bundle of resources that they control (Bridoux, 1997). Second assumption is that resource heterogeneity may persist over time because the resources used to implement firm’s strategies are not perfectly mobile across firms.

Resource Based Biew (RBV): A resource-based view (RBV) is one of the most widely accepted theories of strategic management (Powell, 2001). New organisational resources may increase the flexibility in strategic choices, by allowing firms to benefit from new opportunities (Rangone, 1999).The RBV could be considered as an “inside-out” process of strategy formulation: starting from the internal resources of the firm, their potential for value generation has to be assessed in order to define a strategy allowing the firm to achieve the maximum value in a sustainable way (Grant, 1991; Barney, 1986).

In this way, the firm product development strategy is determined by the resources available and the capability to deploy them in the best way to obtain a good performance.

Dynamic Capabilities Theory:

Dynamic capability philosophy draws on Schumpeterian reasoning, which sees dynamic capability as another rent-creating mechanism based on the competencies of organizations (Schumpeter, 1950). Eisenhardt and Martin (2000) defined dynamic capabilities as ‘a set of specific and identifiable processes’ that are ‘idiosyncratic’ in details and somehow ‘dependent’ in their emergence. Dynamic capabilities of firms may account for the emergence of differential firm performance within an industry (Zott, 2000). Zott (2000) synthesizing insights from both strategic and organizational theory, found performance relevant attributes of dynamic capabilities such as innovativeness of products to be the timing of dynamic capability deployment and learning to deploy dynamic capabilities.

Dynamic capability is about organizational competitive survival rather resource based view’s achievement of sustainable competitive advantage. Dynamic capability theory explains the capacity of an organization to purposefully create, extend or modify its resource base which refers to the choice of strategy an organization adopts to achieve its goals.

5. Conceptual Framework

This section presented the study’s conceptual framework in bid to provide a pictorial view of the study’s key variables. Mugenda and Mugenda (2003) define conceptual framework as a concise description of the phenomenon under study accompanied by a graphical or visual depiction of the major variables of the study. According to Young (2009), a conceptual framework is a diagrammatic representation that shows the relationship between dependent variable and independent variables. Thus, The conceptual model presents the perceived relationships as formulated for testing. The conceptual model shows the various relationships among the variables in the Product development strategy - Performance. According to the model, Financial Performance is the dependant variable with both quantitative and qualitative as indicators is influenced product development strategy.


Independent variable is presented by product development with its corresponding indicators; new product development and improvement of existing products.

ssjar_216_01.jpg
Figure 1:
Conceptual Model

Research Gaps

Literature review was collected on product development strategies and organizational survival in the competitive market of the banking sector. several empirical studies conducted by this study showed that there was a greater relationship between product development strategies and the performance of organizations in different parts of the world. However, the findings of these researchers may not be consistent with the research reviewed by this researcher and cannot be directly applied to this topic due to the economic situation in Zambia.

Chapter Summary

This chapter introduced the performance of a firm and how negative measurements of some key indicators can point to an organization in distress. In addition, this chapter revealed the purpose of the research, which is to measure the Customer Satisfaction in Professional bodies and what product strategies can be used to enhance it; A case study of FNB. The research questions to be investigated were also included, which are, to ascertain how product development strategies can lead to improved operational efficiency and reduced costs for FNB, ultimately enhancing overall performance. Chapter Two and Three will focus on the Literature concerning this topic and the Research Methodology, respectively.

6. Methodology

Research Design

Research design can be defined as the way the researcher will go about answering the stated research questions (Swanson, 2015).

This study adopted a quantitative research design to evaluate the effectiveness of product development strategies in the performance of FNB Zambia. The design was deemed appropriate for this study as it answered the questions; what, how, which, and why on the effect of product development strategy on financial performance, in addition, the study also utilized panel data analysis to establish the relation between product development strategy and financial performance. The numeric data garnered from the questionnaire as the data collection instrument and from secondary literature sources like annual report and company websites was used to test the theory relating to the performance level of the FNB. In addition, the data was used as an inductive approach to develop theory such as what emerges as the top products development strategy and communication channel to enhance the current level of performance (Sanders, 2012). Thus, this method was appropriate for this study as it facilitates the collection of data from a large population. It also made it easier for the researcher to develop a questionnaire that enabled generalization of the findings (Malhotra, 2010).

Study Population

The population of a research study is the all the group members relevant to the case (Sanders, 2012; Thomas, 2015). For this study the population will consist of all the staff from Lusaka FNB in Lusaka province. FNB Zambia received its banking license in November 2008 and began operating in 2009 with an initial three branches across Lusaka and the Copperbelt. The bank has since grown to include a national footprint and now it has its presence across all 10 provinces of Zambia through a network of ATMs, Branches, and Cash Plus agency banking solutions. Thus, it was best fit bank to research on with regard to the effect of product development on the organization performance. The population size for this study was 315. To establish this population size, the researcher identified the total number of FNB branches and employees in Lusaka district that and thereafter, employee population was tabulated as shown below.

Total employees = Number of branches x Average employees per branch

Total employees = 09 branches x 35 employees/branch (avg. of 20-50)

Total employees = 315.


Sample Size

Sample size refers to the number of units that is chosen from the target population from which information is gathered to fulfill the objectives of the researcher (Cooper & Schindler, 2014). For this study the sample size was determined using the Yamane’s formula.

The sample sizes for the population of interest were determined using the Yamane Formula Model. The determination of the sample size using Yamane sample determination Model was done as follows;

ssjar_216_formula_01.JPG
Calculations below give both the targeted populations and their associated sample sizes based on Yamane Formula. Yamane Formula Model can generate a sample size for any size of the population which could be in form of even or old number though it uses a fixed margin of error which is 5%.

ssjar_216_formula_02.JPG
n =176
sample size: Therefore, the sample size for this study was 176 respondents from FNB Lusaka district.

Sampling Frame and Technique

A sampling frame is used in this study was probability sampling and is defined as the complete list of all the members or cases that are in the study population and the selection was done randomly

with each member have equal chance of being picked. From this list a sample is derived (Cresswell, 2014). For this business research the researcher also used nonprobability method of sampling the study population. In a non-probability sampling, the techniques used to select the sample size have an element of subjectivity and the researcher uses their judgment (Cresswell, 2014). This sampling technique was based on the fact that the respondents were unavailable due to the nature of their work; majority are given assignment within and outside Lusaka town hence, challenging to reach all of them. Process used to select the respondents was based on availability of the respondents within the three months of the study.

Data Collection

Questionnaire was the main tool for data collection in this research. In business and management research, the questionnaire is used greatly for surveys (Sanders, 2012). Further, a self-administered questionnaire assists to enhance self-reporting on the sample’s opinions, attitudes, beliefs and values (Swanson, 2015). Questionnaires are defined as all the methods used in data collection, where each person or respondent is asked to answer to the same set of questions that are put in the same predetermined format (deVaus, 2002 a two-section e-questionnaire to collect data. The first section consisted of demographic information such as the age, gender, income, and education of the respondent. The last part of section two explored the respondent’s view of the various communication channels. The e-questionnaires were used due to the physical unavailability of the respondents. The e-questionnaire was sent to all the available members via emails with respective reminders through emails and mobile number.

Sampling Method

The investigator used the purposive sampling technique in this research. The purposes of selecting this technique are that purposeful sampling is a technique widely used in qualitative research for the identification and selection of information-rich cases for the most effective use of limited resources (Patton, 2002). This involves identifying and selecting individuals or groups of individuals that are especially knowledgeable about or experienced with a phenomenon of interest (Cresswell & Plano Clark, 2011). In addition to knowledge and experience,


Bernard (2002) and Spradley (1979) note the importance of availability and willingness to participate, and the ability to communicate experiences and opinions in an articulate, expressive, and reflective manner.

Data Analysis

A total of 80 questionnaires were developed and administered, resulting in a response rate of 75 out of 80 which were filled in correctly. Upon completion of data collection, the questionnaires were scored and data edited, coded and entered into the computer for analysis. The data was analysed and reported by descriptive narrative (Sounders and Lewis, 2012). The study also used ANOVA and Chi-square test to determine the association between corporate governance and performance (Hauke and Kossowski, 2011). The results of this data gave the researcher a basis to make conclusions about the study. All the tests and were conducted at 95% confidence level (p-value 0.05).

Ethical Consideration

The research observed main ethical issues including, voluntary nature of participation, obtaining of informed consent; ensuring confidentiality and privacy of participants, institutional ethical issues, which included obtaining authority to conduct research and scientific honesty (Fleming, 2011).

7. Results

Product development strategies has FNB Zambia employed for its e-wallet product?

Are you aware of product development strategy?

When respondents were asked if they Are aware of product development strategy majority 61.5% said yes, they were aware only 38.5% of the respondents said no. This imply that most respondents were aware of product development strategy majority.

ssjar_216_02.JPG
Figure:
Pie chart distribution of respondent’s awareness of product development strategy
Source:field survey, 2024

Product Development Strategy

The researcher was interested in knowing the current product development strategies being used to promote e-wallet product, in multiple response results, it was revealed that FNB is currently using several product development strategies, and these were revealed to be Mobile-first approach at70%, User-centered design at 90%. Integration with existing FNB products at 60%, Partnership with fintech companies at 87%. One of the respondents mentioned that “ FNB must put first digital transformation and become the leader in digital transformation to improve customer experience as well as operational efficiency alleging that with this, FNB will be able to meet evolving customer needs.Innovation Centered around customers. Another respondent mentioned that the Bank should develops products and services that are customer-centric achieved through customer feedback and market research.”

ssjar_216_03.JPG
Figure: Key e-wallet product development strategies
Source: field survey, 2024


How would you rate the effectiveness of FNB's current product development strategy in achieving financial performance goals?

Therefore, using the scale of 1 to 5 from very ineffective to very effective, majority 55.6% were picked 4 which is effective, whilst 22.2% picked partially effective and the rest 22.2% picked very effective. Thus, it can be said that the current FNB product development strategy is effective in achieving financial performance goals of the bank.

ssjar_216_04.JPG
1=Very ineffective| and 5=Very effective

Figure: Distribution of Respondents responses about effectiveness of FNB's current product
Source: field survey, 2024

How does FNB's product development strategy align with the organization's overall financial performance goals?

To learn the link between product development strategy and financial performance, the researcher asked if at all FNB's product development strategy align with the organization's overall financial performance goals. Out of 141 22.2% said it is partially aligned and the rest majority 78.8 said it aligned the financial performance.

ssjar_216_05.JPG
Figure: Distribution of the respondents’ responses on whether FNB's product development strategy align with the organization's overall financial performance goals.
Source: field survey, 2024

How would you rate the efficiency and effectiveness of each stage in the product development process?

The results indicate that FNB's efficiency and effectiveness of each stage in the product development process had mixed effects. While most respondents said it was efficient and effectives there is still a significant number who were of opinion that it is not very efficient and effective in every stage of the product development process.

ssjar_216_06.JPG
Figure: Distribution of the respondents’ responses on FNB's product development strategy efficiency and effectiveness of each stage in the product development process.
Source: field survey, 2024

The effectiveness of FNB Zambia Product development strategy on financial performance

How has FNB's financial performance changed over the past 3 years?

Regarding FNB's financial performance over the past 3 year. The study results indicates that 50% it improved significantly, 33.3% it improved slightly and only 16.7% said it remained the same.

ssjar_216_07.JPG
Figure: Respondents response on FNB's financial performance changed over the past 3 years
Source: field survey, 2024


Trend in revenue volume between e-WALLET & b2w

The trend in revenue volume between e-wallet and B2W shows that from 2023 april the revenue volume for e-wallet has been declining meanwhile the revenue volume for B2w has been increasing. However, the overall total revues have increasing from 2023 to 2024.

ssjar_216_08.JPG

The coefficient of variability in revenues for e-wallet and B2W PRODUCTS

The mean of the return on assets for the period of study was 0.0198 which implies that significant returns were not realized on the assets among FNB branches in Lusaka. With a maximum value = 0.5150, minimum value = -0.3214 and standard deviation = 0.0526 indicated that the digression of ROA during the period of study was high. The coefficient of variability was 2.6566 which indicates a high variability in financial performance between the best and least performing banks.

The result shows that the mean of total revenue from e-wallet cleared through the B2W to total bank revenue during the period of study was 94.4815 billion which imply that banks had a worth noting proportion of revenue from e-wallet and B2w revenue. The minimum and maximum values were -1046.3926 and 9468.3608 billion respectively and the standard deviation was 682.4214 which denote a high deviation. The coefficient of variability was 7.2228 indicating a high variability in revenues from e-wallet and B2W PRODUCTS.

NMinimum MaximumMeanStd deviation
StatisticsStatisticsStatisticsStatisticsStatistics
ROA140-0.32140.5150.01980.0526
e-wallet140-1040469468.30194.4815682.4214
B2W14009930.08886.0064711.0004

Relationship between Product development strategies and FNB financial Performance

Correlation

The correlation between ROA and the predictor variables (R=0.545 was greater than 0.5) meaning there was a strong positive correlation between ROA and the predictor variables. The coefficient of the regression analysis denotes the amount of deviation in the predicted variable that is to say ROA that is explained by the predictor variables. The square of R=0.297 reveals that 29.7% of the changes in ROA was attributed to predictor variables. The Durbin-Watson test statistic was 1.158 which indicated that no correlation existed among the residuals in the model.

ModelBErrorBetaтSig.
ROA (Constant)-0.012-0.005-2.2780.024
e-wallet-1.6E-050-206-0.1930.847
Mobile-first approach.1.55E-0502120.1980.843
User-centered design.-0.0270.016-0.106-1.7530.081
Integration with existing FNB products.0.2160.0240.5338.8460. 00

Pearson Correlation showed a negative correlation (r) of -0.017 between ROA and insignificant negative relationship between ROA and the predictor variable

What challenges does FNB Zambia face in implementing effective product development strategies?

The study found that the major challenges faced during the product development process were Complex Supply Chains 35%, Varying Product lifecycle phases 60%, regulatory Compliance 86%, Functional Collaboration 27%, Resources 90%, Pricing challenges 93%, Turnaround time 58%, Lack of knowledge ant PD 30%, Product design challenges 40% whilst 6% mentioned that they were not aware of the challenges faced during the product development process.

Additionally, its other staff participants mentioned that “there is always a challenge of Having go engage South Africa on everything delays the process this has proved to be a challenge.” Other respondents mentioned that “challenges related to development costs spill over the budget which arises due to unexpected costs posing financial constraints on the business also does affect the company strategic development,


along with time constraints, since meeting deadlines is critical. Delays in any phase can impact the overall timeline.”

ssjar_216_09.JPG
Figure: Challenges faced during the product development process
Source: field survey, 2024

8. Discussions

This chapter discusses the results of a study on the effectiveness of product development strategy on FNB financial performance in Lusaka District. The research used a mixed methods approach, including questionnaires and secondary data analysis in view of the results from the study conducted and the implementation of the proposed system in relation to the objectives of this study which was assessment of the effectiveness of product development strategy on the financial performance of FNB in Lusaka. Thus, the aim of the study was achieved by establishing responses to the study objectives. The demographic characteristics of the respondents were analysed, showing that the majority were aged between 36-51 years, male, and had around 7 years of experience with a first-degree level of education.

The study found that most respondents were aware of FNB's product development strategy, which includes short- and long-term financing options, diversification strategies, market product development, customer satisfaction, and digital transformation. The effectiveness of the current product development strategy was rated as effective by the majority of respondents. Strengths of the strategy included strong regional presence, diverse range of products and services, and innovation adoption, while weaknesses included vulnerability to economic downturns, low technology adoption, and lack of variety (Moyo et al. (2019)

The study Revealed a weak relationship between product development strategy and all aspects of performance.

(Multiple r range between 0.062 and 0.388), and that very low percentages (Adjusted R =3.0% and below) variation in company performance is explained by organizational strategy. The results further reveal that most product development strategy variables have statistically not significant negative effects like operational efficiency, product/service quality, sugar sales and profit after tax (low t-values as well as negative = -0.027, -0.627 -1.718) on some indicators of performance. The results do not concur well with the findings of previous studies, which indicate long term profitability of a firm due to product development strategy (Geroski, Machin and Reenen, 1993), developing new products being fundamental to sustained financial health for profit firms (Sharma and Lacey, 2004). However results are partially in agreement with the findings of Johnson & Aggarwal (1988) and Muller (1987) opined that changes in patterns of consumption tend to dissipate profits to sponsoring firms.

The alignment of FNB's product development strategy with the organization's financial performance goals was identified by the majority of respondents. The results implies that FNB product development strategy is directly linked to financial outcomes. This outcome is also supported by (Moyo et al. (2019) who argued that innovation has a significant impact on financial performance. Moyo and colleagues identified that banks that adopt innovative strategies tend to have improved financial performance.

The efficiency and effectiveness of each stage in the product development process were rated positively overall, with some mixed opinions. Key challenges faced during the product development process included regulatory compliance, resource constraints, pricing challenges, and product design challenges. The results obtained in this study are partially in agreement with finding from Khan et al. (2020) who reportedly found only that apositive relationship between product development and bank performance. Khani colleagues also identified that banks that invest in product development tend to have better financial performance.

Additionally, Al-Shammari et al. (2018) also reported similar findings to Al-shammari where it was reported that there is a positive relationship between product development and customer satisfaction.


Al-shamarri argued that banks that focus on product development tend to have higher customer satisfaction levels (Ibid).

FNB's financial performance was reported to have improved significantly over the past 3 years, with key financial performance indicators including revenue growth, profitability, market share, and customer satisfaction. Overall, the level of customer satisfaction with FNB's products and services was rated as satisfied by the majority of respondents. This result is also in line with the findings from Benson et al, (2015) who carried out research on effect of new product development strategy on financial performance of FNB. The results indicate that FNB's current product development strategy has both positive and negative effects on financial performance. On the one hand, the strategy has contributed to steady revenue growth, indicating effective product development and market alignment (Kotler & Keller, 2016). On the other hand, net income has been affected by economic downturns and over-reliance on interest income, highlighting vulnerabilities in the strategy (Hull, 2017).

Areas for improvement in the product development process include diversifying product offerings to appeal to a broader demographic range, exploring opportunities for international expansion, and enhancing the product development process to address niche market risks and demographic skew (Cooper, 2017).

9. Conclusions and Recommends

Conclusion

This study was aimed at evaluating the effectiveness of product development strategy on the financial performance of FNB in Lusaka. The results obtained, revealed that FNB's current . On the relationship between product development and elements of performance gave mixed outcomes show both low (capacity utilization and profit after tax) and high (increment in turnover) relationships. However, regression tests revealed a weak relationship between product development strategy and all aspects of performance. While 55.6% found the strategies effective, challenges such as regulatory compliance and resource limitations were identified.

This study concludes that product development strategy has a significant effect on FNB Zambia's financial performance, particularly in the context of its E-wallet product. While the strategy has contributed to revenue growth and market share expansion, vulnerabilities to economic downturns and low technology adoption hindered its effectiveness. Despite weaknesses like vulnerability to economic downturns, financial performance has improved significantly in the past 3 years. The implication of this study is that it will inform strategic decision-making for banks seeking to improve financial performance, not only that but also provide insights for policymakers to support innovative product development in the banking sector.

Study Recommendations

Following the analysis of responses and interaction with the responses, the researcher is proposing that stud focus on factors to strengthen corporate governance in SME’s:

Based on the results, the study recommends that FNB should:

  • Conduct comprehensive market research to identify emerging trends and customer needs.
  • Diversify product offerings to appeal to a broader demographic range and reduce reliance on interest income.
  • Adopt an agile product development approach to reduce time-to-market and increase product success rate.
  • Explore opportunities for international expansion to reduce reliance on regional markets.

Author Contributions: Conceptualization, methodology writing review and editing and analysis (E.K) The author has decided to published this version of the review article,   Editing the article (DR. A. M)

Funding: Funding for this research was not provided. The authors have no other relevant affiliations or financial involvement with any organization or entity with a financial interest in or financial conflict with the subject matter or materials discussed in the manuscript apart from those disclosed. No writing assistance was utilized in the production of this manuscript.

Institutional Review Board Statement: This study was approved by the University of Zambia Humanities and Social Sciences Ethics Committee.


Informed Consent Statement: Not applicable.

Data Availability Statement: The datasets used during the current study are available from the corresponding author on rational request.

Acknowledgements: I, am grateful Dr A. Mulenga for her unreserved support and supervision both during the preparation of the proposal and the write up of this dissertation. I remain sincere, grateful and indebted to my Daughter and brothers not forgetting all colleagues, whose words of encouragement, affection and prayers served me as a source of strength and inspiration throughout my academic journey.

Last but not least, I thank my Lord God Almighty for the rare opportunity given to me to accomplish my dream of acquiring a Master’s of Business Administration General.

Conflicts of Interest: The authors declare no conflict of interest.

References

1. Abor, J., & Adjani, C. K. d. (2007). Corporate governance and the small and medium enterprises sector: Theory and implications. Corporate Governance: The International Journal of Business in Society, 7(2), 111–122. https://doi.org/10.1108/14720700710739769.

2. Adnoun, G. C. (2017). Corporate governance in small and medium scale enterprises: Any relevance?. SSRN Electronic Journal. https://doi.org/10.2139/ssrn.2839684.

3. Cadbury, R. (1992) Report of the committee on the financial aspects of corporate governance. London: Gee and Company Publishing Ltd.

4. Bernard HR. (2002). Research methods in anthropology: Qualitative and quantitative approaches. (3rd ed.). Walnut Creek, CA: Alta Mira Press.

5. Classes, S., Django, S., Fan, J. P. H., & Lang, L. H. P. (2002). Disentangling the incentive and entrenchment effects of large shareholdings. Journal of Finance, LVII(6), 2741–2771. https://doi.org/10.1111/1540-6261.00511.

6. Creswell JW, & Plano Clark VL. (2011). Designing and conducting mixed method research. (2nd ed.). Thousand Oaks, CA: Sage.

7. Malaise, G.M., Duggal, S., & Muhwanadavaka, R. (2013) Corporate governance perspectives for Zimbabwean SMEs. International Journal of Economy, Management and Social Sciences, 2(8), 616.

8. Ndagu, W., & Obuobi, R. (2010) Strengthening SME's: A guide to business management and governance for small and medium enterprises in east Africa. Nairobi, Kenya: Master Publishing.

9. Mohamed Ali, F. H. (2006). Board, audit committee, culture and earnings management: Malaysian evidence. Managerial Auditing Journal, 21(7), 783-804.

10. Abdullah, S. N. (2004). Board composition, CEO duality and performance among Malaysian listed companies. Corporate Governance, 4(4), 47-61.

11. Ameer, R., Ramli, F., & Zakaria, H. (2010) A new perspective on board composition and firm performance in an emerging market. Corporate Governance, 10(5), 647–661.

12. Ararat, M., Orbay, H., & Yurtoglu, B. B. (2010) The effects of board independence in controlled firms: Evidence from Turkey. Working Paper.

13. Berghe, V. D, & Baelden, T. (2005). The complex relation between director independence and board effectiveness, Corporate Governance, 5.

14. Sharifah Faatihah Syed Fuzi et al. (2016). Procedia Economics and Finance, 37(5), 61-83.

15. Bradbury, M., Mak, Y., & Tan, S. (2006). Board characteristics, audit committee characteristics and abnormal accruals. Pacific Accounting Review, 18, 47-68.

16. Byrd, J., Cooperman, E. S, & Wolfe, G. A (2010). Director tenure and the compensation of bank CEOs. Managerial Finance, 36(2), 86-102.

17. Cybinski, P., & Windsor, C. (2013). Remuneration committee independence and CEO remuneration for firm financial performance. Accounting Research Journal, 25(3).

18. Dunn, P., & Sainty, B. (2009). The relationship among board of director characteristics, corporate social performance and corporate financial performance. International Journal of Managerial Finance, 5(4), Organizational Change, 5(3), 390-416.


19. Fama, E., & Jensen, M. C. (1983). Separation of ownership and control. Journal of Law and Economics, 26, 301–325.

20. Fitriya Fauzi, & Locke, S. (2012). Board structure, ownership structure and firm performance: A study of New Zealand listed-Firm. Asian Academy of Management, 8(2), 43-67.

21. Foo, Y. B., & Mat Zain, M. (2010). Board independence, board diligence and liquidity in Malaysia. Journal of Contemporary Accounting & Economics, 6, 92–100.

22. Fuzi, S. F S, Rahim, M., & Tan, A. (2012). Factors influencing performance of independent directors in Malaysia. IEEE Symposium on Humanities, Sciences and Engineering Research.

23. Garg, A. K. (2007). Influence of board size and independence on firm performance: A study of Indian companies. Vikalpa, 32(3).

24. Hermalin, B., & Weisbach, M. (1991). The effects of board composition and direct incentives on firm performance. Financial Management, 20, 101–112.

25. Johari, N. H, Saleh, N. M., Jaafar, R, & Hassan, M. S. (2008). The influence of board independence, competency and ownership on earnings management in Malaysia. International Journal of Economics and Management 2(2), 281–306.

26. Kakabadse, N. K, Yang, H., & Sanders, R. (2010). The effectiveness of non-executive directors in Chinese state-owned enterprises. Management Decision, 48(7), 1063-1079.

27. Leung, S., Richardson, G., & Jaggi, B. (2014). Corporate board and board committee independence, firm performance, and family ownership.

28. (2012). Concentration: An analysis based on Hong Kong firms. Journal of Contemporary Accounting and Economics, 10, 16-31.

29. Nowak, M., & McCabe, M. (2008). The independent director on the board of company directors. Managerial Auditing Journal, 23(6), 545-566.

30. Sang-Woo Nam, & Chong Nam. (2004). Corporate governance in Asia. Recent evidence from Indonesia, Republic of Korea, Malaysia, and Thailand. Asian Development Bank Institute.

31. Shakir, R. (2010) Board size, board composition and property firm performance.

32. Sheikh, N. A, Wang, Z., & Khan, S. (2013). The impact of internal attributes of corporate governance on firm performance Evidence from Pakistan. International Journal of Commerce and Management, 23(1).

33. Wallison,P. J. (2006). All the rage: Will independent directors produce good corporate governance?. American Enterprise Institute for Public Policy Research.

34. Wang, Y., & Oliver, J. (2009). Board composition and firm performance variance: Australian evidence. Accounting Research Journal, 22(2), 196-212.

35. Wooi, H. C, & Ming, T. C. (2009). Directors’ pay-performance: A study on Malaysian government linked companies. CenPRIS Working Paper No. 110/09, Universiti Sains Malaysia.

36. Zhang, L. (2012). Board demographic diversity, independence, and corporate social performance. Corporate Governance, 12(5), 686-700.

37. Zinkin, J. (2010). Independent directors must learn to ask CEOs the right questions. The Star.

Disclaimer / Publisher's Note: The statements, opinions and data contained in all publications are solely those of the individual author(s) and contributor(s) and not of Journals and/or the editor(s). Journals and/or the editor(s) disclaim responsibility for any injury to people or property resulting from any ideas, methods, instructions or products referred to in the content.